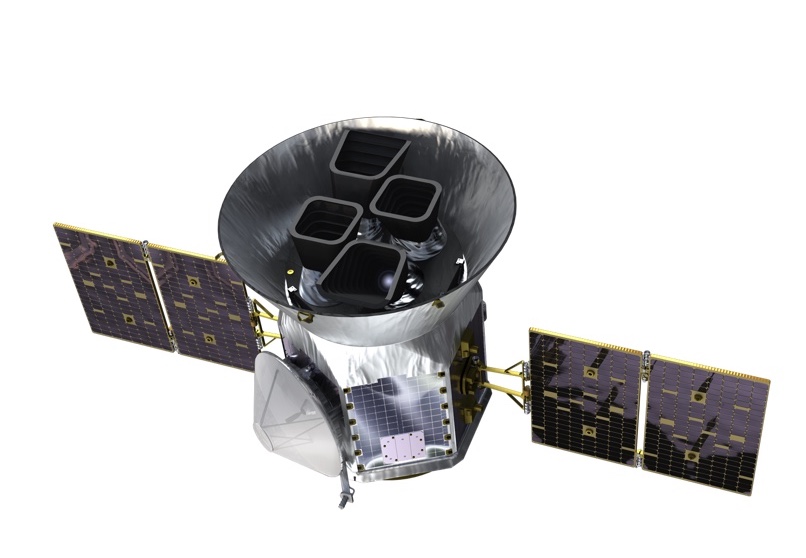
The TESS observatory consists of a payload and spacecraft. The payload is comprised of four identical wide field-of-view CCD cameras and their associated hoods, mount, sun shield and a Data Handling Unit (DHU). The payload is coupled to the spacecraft, an Orbital Sciences LEOStar-2/750 satellite bus. The spacecraft provides power (via two deployable solar arrays), attitude control, data storage, and communications/transmission.
TESS Cameras
TESS is equipped with four refractive cameras, each with a 2000x2000 pixel CCD that provides a 24x24 degree field-of-view. The combined field-of-view from all four cameras yields a 24x96 degree observing sector.

Bandpass
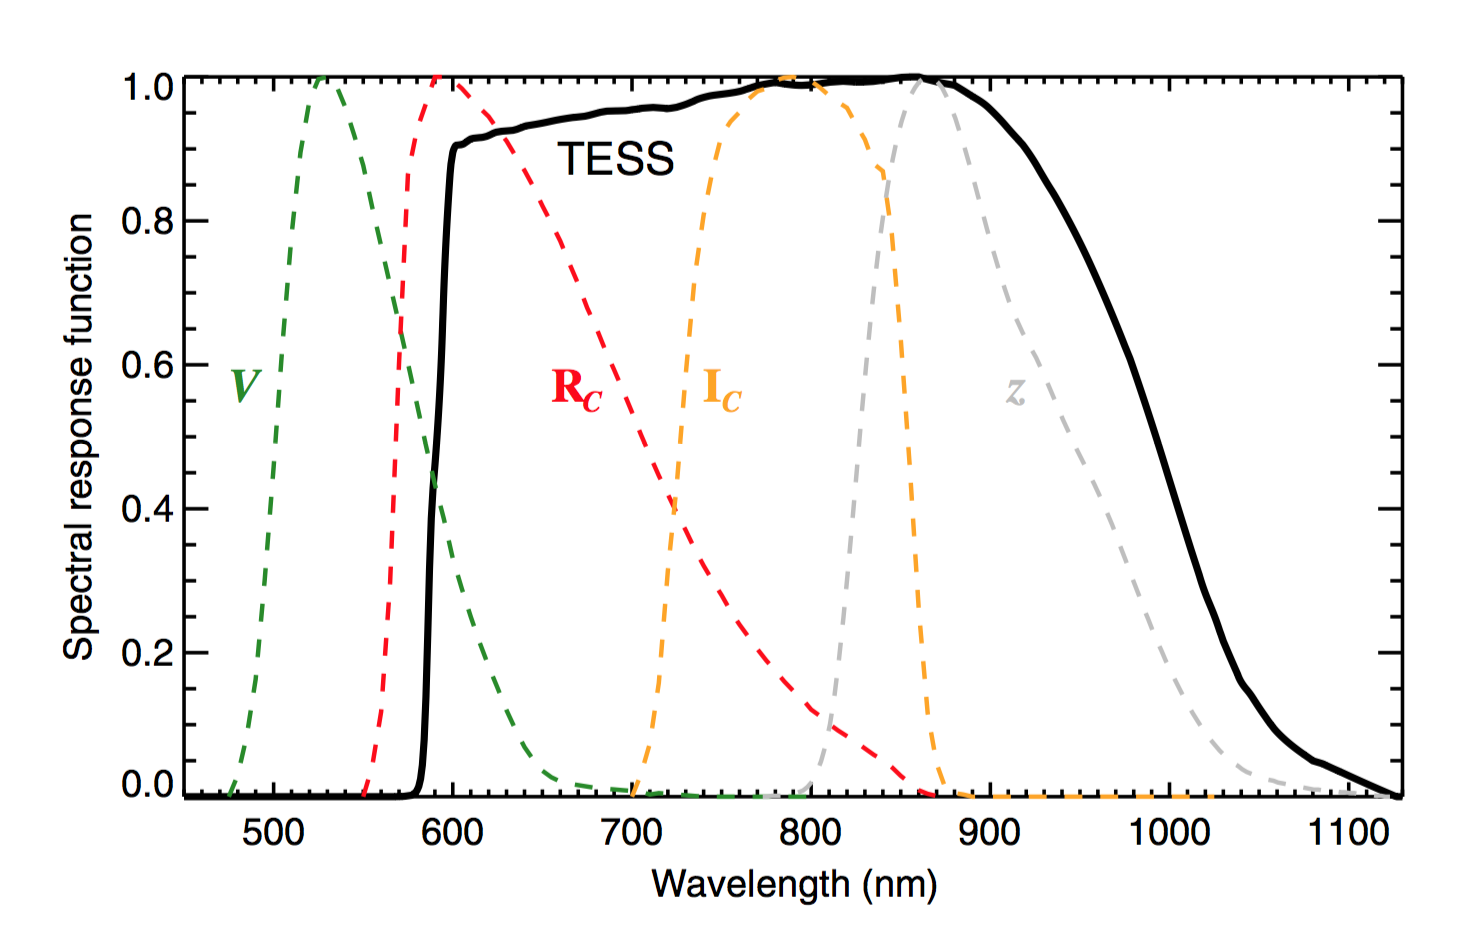
The TESS bandpass includes wavelengths from 600 to 1000 nm.
[Enhanced sensitivity to red wavelengths is desired because small planets are more easily detected around small stars, which are cool and red. These considerations led to the choice of a 600 to 1000 nm bandpass. The red end represents the red limit of silicon CCD sensitivity, and the width of 400 nm was the largest practical choice for the optical design.]
 The TESS spectral response function (black line), defined as the product of the long- pass filter transmission curve and the detector quantum efficiency curve. Also plotted, for comparison, are the Johnson–Cousins V, R C , and I C filter curves and the Sloan Digital Sky Survey z filter curve. Each of the functions has been scaled to have a maximum value of unity. Image Credit: Ricker et al. (2015)
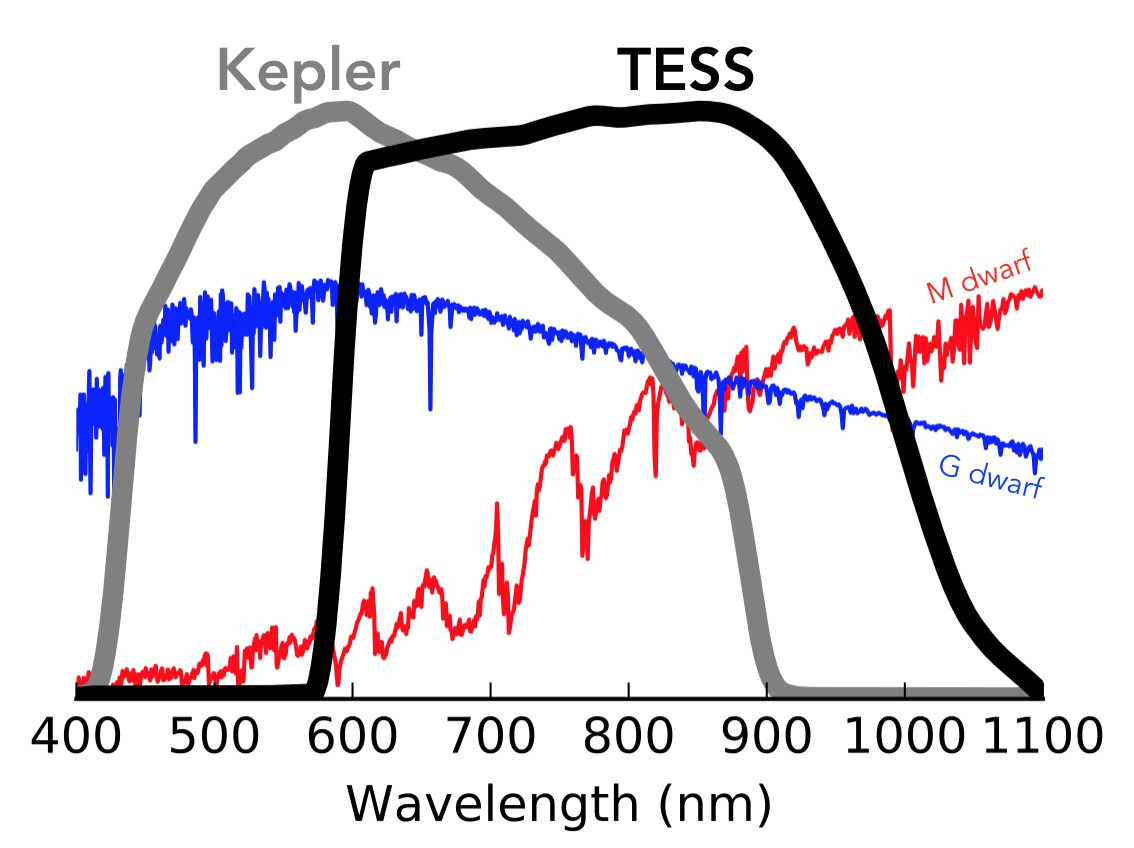
TESS will observe a much larger number of M dwarfs compared to the Kepler mission for several reasons. Planets are easier to detect around these small stars (the planets induce larger transit signals). M dwarfs in the Kepler field-of-view were faint due to the distance of the field to Earth, thus Kepler only monitored a few thousand M dwarfs over it's prime 4-year mission. Most nearby stars are M dwarfs, TESS will therefore observe a much larger sample of M dwarfs. Because M dwarfs are cool and red, the TESS bandpass will be more sensitive to red wavelengths.

Image Credit: Zach Berta-Thompson with data from Sullivan at al. (2015)